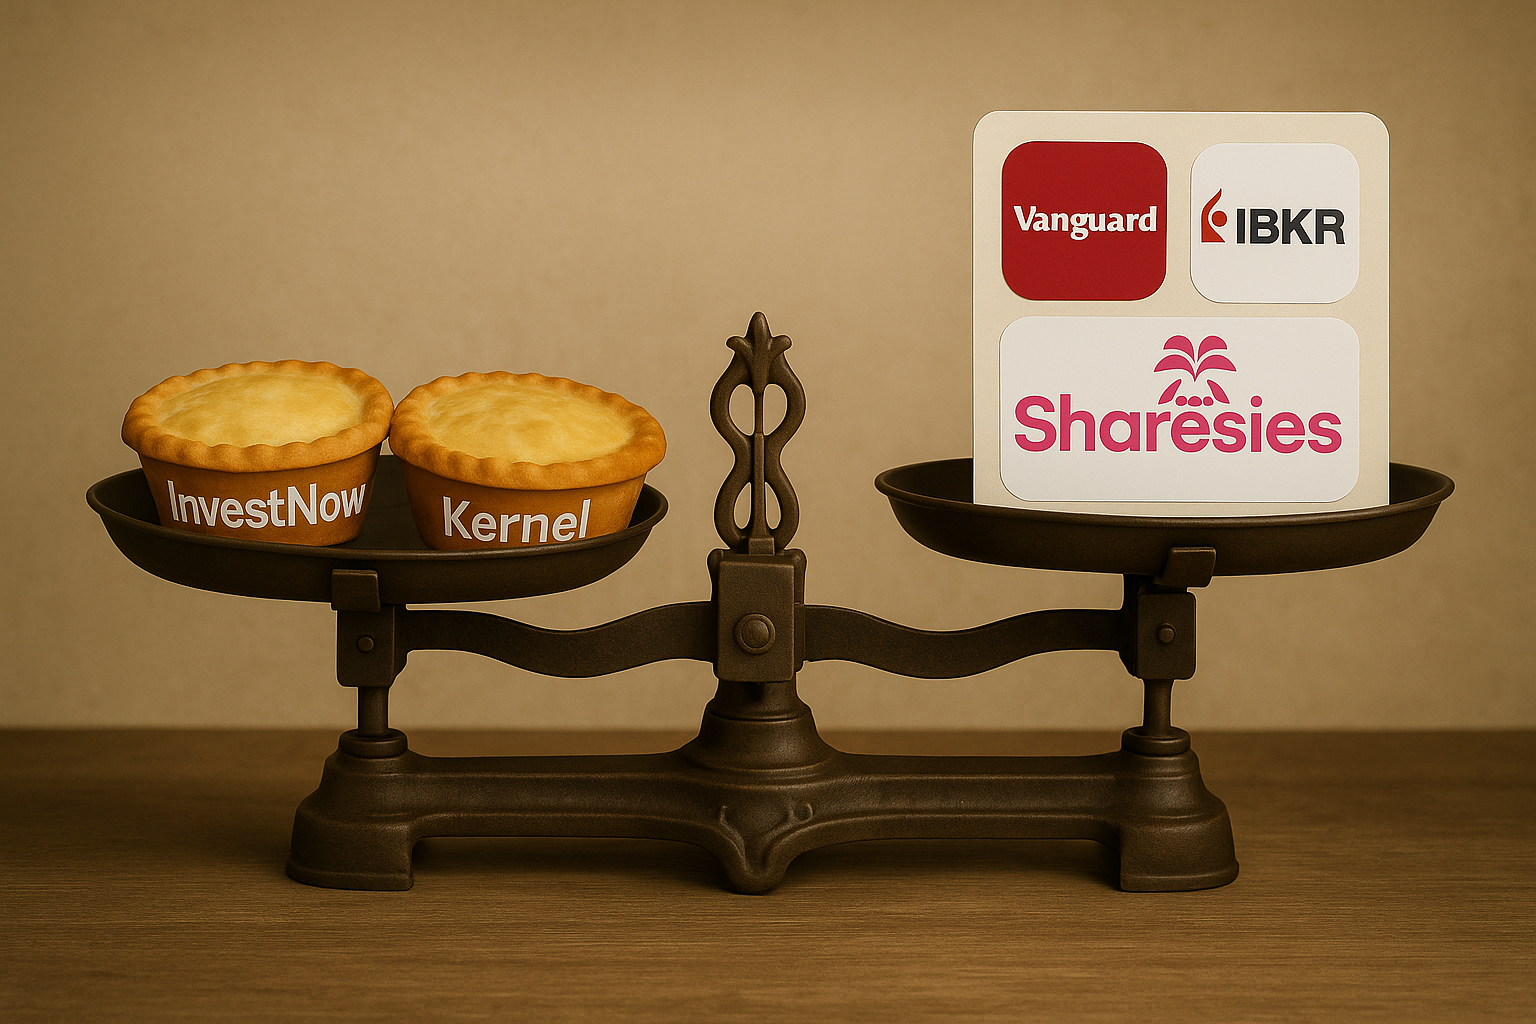
US 500 PIE Funds vs Direct ETF Investment: 2025 Total Returns Comparison

This page compares the performance of two popular NZ based US500 PIE funds (InvestNow Foundation Series and Kernel Wealth) against directly holding index ETF through popular brokers IBKR, Sharesies and Kernel. The total impact of taxes, fees and foreign exchange is calculated because all that really matters is the bottom line: How much $ will you have after withdrawal? Enter your tax rates to find out you would have after investing $49,000.
There is also a FIF paying scenario to demonstrate the effects of FIF FDR income tax on long term returns. It is assumed 1 in 5 years is negative and will use the CV method to pay zero income tax so a blended rate is used: , also it does not account for the complexities of negative market years and quicksale adjustments.
Be sure to withdraw any dividends from your VOO holding to avoid exceeding the $50,000 FIF de minimis. Total returns include the dividends as if they were reinvested. This is not financial advice, do your own research before investing. Also checkout the broker fees pricing calculator if you choose to invest in an ETF directly.
Your Tax Rates
Total Returns after Withdrawal Fees and Tax
| Year | IBKR + VOO | Sharesies + VOO | Kernel + VOO | Kernel PIE | Invest Now F/S PIE | IBKR + VOO w/FIF |
|---|---|---|---|---|---|---|
| 0 | $49,482 | $48,498 | $48,578 | $49,000 | $48,755 | $49,482 |
| 1 | $53,725 | $52,678 | $52,761 | $52,601 | $52,464 | $53,105 |
| 2 | $58,332 | $57,217 | $57,303 | $56,468 | $56,454 | $56,992 |
| 3 | $63,334 | $62,144 | $62,234 | $60,618 | $60,747 | $61,164 |
| 4 | $68,764 | $67,494 | $67,588 | $65,074 | $65,364 | $65,642 |
| 5 | $74,660 | $73,303 | $73,401 | $69,856 | $70,330 | $70,447 |
| 6 | $81,062 | $79,610 | $79,713 | $74,991 | $75,673 | $75,604 |
| 7 | $88,013 | $86,457 | $86,566 | $80,503 | $81,420 | $81,139 |
| 8 | $95,559 | $93,892 | $94,006 | $86,420 | $87,602 | $87,078 |
| 9 | $103,753 | $101,964 | $102,084 | $92,771 | $94,252 | $93,453 |
| 10 | $112,649 | $110,728 | $110,855 | $99,590 | $101,405 | $100,294 |
| 11 | $122,308 | $120,243 | $120,378 | $106,910 | $109,100 | $107,636 |
| 12 | $132,795 | $130,575 | $130,717 | $114,768 | $117,377 | $115,515 |
| 13 | $144,181 | $141,792 | $141,943 | $123,203 | $126,281 | $123,971 |
| 14 | $156,543 | $153,971 | $154,131 | $132,259 | $135,859 | $133,046 |
| 15 | $169,966 | $167,194 | $167,364 | $141,980 | $146,163 | $142,785 |
Table of Fees
| Fee Type | IBKR + VOO | Sharesies + VOO | Kernel + VOO | Kernel PIE | Invest Now F/S PIE | IBKR + VOO w/FIF |
|---|---|---|---|---|---|---|
| Forex costs | $3.33 | $245.00 | $196.00 | $0.00 | $0.00 | $3.33 |
| Trading fees | $0.50 | $8.20 | - | - | $0.00 | $0.50 |
| Subscription fees | - | - | $15.00 | - | - | - |
| Referral bonus (new customers) | $490.00 | $5.00 | $0.00 | $0.00 | $0.00 | $490.00 |
| Entry costs | -$486.17 | $248.20 | $211.00 | $0.00 | $0.00 | -$486.17 |
| Fees drag | 0.03% | 0.03% | 0.03% | 0.25% | 0.03% | 0.03% |
| Tax on dividends | 0.40% | 0.40% | 0.40% | - | - | - |
| PIE Tax on FIF | - | - | - | 1.40% | 1.40% | - |
| Total drag | 0.43% | 0.43% | 0.43% | 1.65% | 1.43% | 1.68% |
| Effective growth rate | 8.57% | 8.57% | 8.57% | 7.35% | 7.57% | 7.32% |
| Fixed exit costs | $3.83 | $8.33 | $15.00 | $0.00 | $0.00 | $3.83 |
| Variable exit costs | 0.00% | 0.50% | 0.40% | 0.00% | 0.50% | 0.00% |
